Before you measure: four rules
- Write the definitions downDecide what counts as "done", when the clock starts and which jobs are included, then keep it that way. A number that changes definition every month can't show a trend.
- Separate guest requests from faults"Two extra towels to 412" and "AC not cooling in 412" are different work with different targets. Report them separately, or fast towel deliveries will hide slow repairs.
- Use medians and rolling periodsResponse and resolution times are skewed: most jobs are quick and a few take weeks. The median shows the typical job. In a hotel under about 60 rooms, use rolling four-week figures, because monthly percentages swing on a handful of jobs.
- Never use a KPI to punish one personThe moment a number is used against someone, it gets gamed. Jobs get closed before they're fixed, and due dates quietly move. Use KPIs to find problems in the process, then fix the process.
The eight KPIs at a glance
| KPI | Formula | Tells you |
|---|---|---|
| On-time rate | Jobs done by their due date ÷ all jobs due in the period | Whether promises are kept |
| First response time | Median time from reported to first action | How fast someone picks it up |
| Resolution time | Median time from reported to done | How long the problem lasts |
| Re-open rate | Jobs reopened ÷ jobs closed | Whether fixes hold |
| Backlog size and age | Open jobs, and how old they are | Workload and what's stuck |
| Preventive share | Preventive hours ÷ all maintenance hours | How much work is planned |
| Repeat faults per asset | Faults per unit in the last 12 months | Which equipment keeps failing |
| Rooms out of order | Out of order room nights ÷ room nights available | What maintenance costs in rooms |
1. On-time rate
The share of jobs finished by their due date. It is the simplest measure of whether maintenance does what it says it will.
- How to calculate itTake every job whose due date fell in the period. Count those completed on or before the due date. Divide by the total, including jobs still open and past due.
- What can misleadLeaving out jobs that are still open, which flatters the rate badly. Due dates that are loose, or moved quietly when a job runs late. A flood of easy jobs, such as guest amenity requests, lifting the average while repairs slip.
- How to improve itSet due dates from agreed targets for each priority, not by feel. Record every due date change with a reason. Run a weekly backlog review so past-due jobs get a decision instead of drifting.
- Example targetMany hotels aim for nine in ten jobs or better closed on time, with urgent guest-affecting jobs held to a stricter standard.
2. First response time
How long a job waits before someone acts on it. For a guest standing in a hot room, this is the number that decides whether they feel looked after.
- How to calculate itFor each job, the time from when it was reported to the first real action: accepted by a named person, marked in progress, or a reply to the reporter. Report the median, split by priority and by guest request versus internal job.
- What can misleadCounting automatic assignment as a response, when nobody has looked at the job. Engineers tapping "start" from the workshop to stop the clock. Night and weekend jobs, which behave differently and should be reported apart.
- How to improve itOne queue that everyone reports into, so nothing waits in a notebook or a chat group. Jobs routed to the person on shift, with a notification on their phone. A clear rule for who covers when the duty engineer is busy.
- Example targetMany hotels aim to respond to an in-room guest problem within minutes, roughly the time it takes to walk to the room, and to pick up routine jobs within the same shift.
3. Resolution time
How long the problem lasts, from report to fix. It is close to what industrial maintenance calls mean time to repair, but measured from the guest's point of view.
- How to calculate itFor each completed job, the time from reported to done. Report the median and, if you can, the slowest tenth of jobs, by priority and by category. AC, plumbing and electrical usually behave very differently.
- What can misleadAverages, which a few month-long jobs pull up. Jobs closed when the part is ordered, not when the fault is fixed. Preventive work mixed in with repairs. Long waits for parts or contractors, which are real, but belong in their own category so you can act on them.
- How to improve itStock the parts that stall jobs most often. Split big jobs into projects so one long task doesn't sit open for months. Close jobs at the job, on the phone, with a photo.
- Example targetMany hotels aim to fix in-room guest problems during the guest's stay, often within an hour or two for simple faults, and to close routine repairs within a few days.
4. Re-open rate
The share of closed jobs that had to be opened again because the fix didn't hold. It is the main quality check on everything else: fast work that fails again isn't fast.
- How to calculate itJobs reopened in the period divided by jobs closed in the period. If your team tends to open a new job instead of reopening the old one, also count new jobs for the same room and fault within 14 days.
- What can misleadA low re-open rate can simply mean people open fresh jobs instead of reopening. A high one can mean guests are reporting more, which is good. Look at the jobs themselves, not just the number.
- How to improve itTest before closing: run the AC for ten minutes, flush the toilet twice, run the shower hot. Use checklists with required steps for common repairs. Ask the guest, or the housekeeper, whether it is fixed. Treat every re-open as a small root-cause question.
- Example targetMany hotels aim for re-opens to be rare, a few in every hundred jobs, and look at each one.
5. Backlog size and age
How many jobs are open, and how long they have been waiting. Size shows workload. Age shows what is stuck, and age matters more.
- How to calculate itSize: the count of open jobs on a fixed day each week. Age: for each open job, days since it was reported. Track the median age, the age of the oldest job, and the count older than 30 days. Alongside it, chart jobs created against jobs done each week.
- What can misleadSize on its own punishes good reporting: a hotel that encourages staff to report everything will have a bigger backlog than one where problems go unreported. A mass close of old jobs makes the numbers look great for one week without fixing anything.
- How to improve itA weekly review where every old job gets an owner, a next step or a close. Habits that stop jobs piling up: one owner at creation, honest on-hold reasons, big jobs split into projects.
- Example targetMany hotels aim for no job older than 30 days without a written next step, and an oldest-job age that falls month on month.
6. Preventive vs reactive share
How much of maintenance time goes to planned work, such as preventive maintenance and inspections, compared with fixing things that have already broken. A rising share usually means fewer breakdowns later.
- How to calculate itHours on preventive and inspection work divided by all maintenance hours in the period. If you don't record hours, use job counts weighted by a rough standard time per job type, and say so.
- What can misleadCounting jobs instead of hours: a two-minute filter check and a three-hour pump repair each count as one. Guest amenity requests counted as reactive maintenance. Preventive jobs ticked off without being done, which a photo on the key steps prevents.
- How to improve itProtect preventive hours in the weekly plan, plan room visits with the front desk, and turn repeat faults into preventive tasks. Our preventive maintenance checklist is a starting list.
- Example targetMany hotels aim for a share that rises steadily as preventive plans take hold, rather than a fixed number. Factory benchmarks don't fit well, because guest requests make some reactive work part of the job.
7. Repeat faults per asset
How often the same unit fails. One AC unit with five calls in a year costs more, in labor and in guest goodwill, than five units with one call each.
- How to calculate itFor each asset, the number of fault jobs in the last 12 months. Flag any unit at three or more. Rank the top ten and track how many units sit above your threshold.
- What can misleadFaults logged against the room rather than the unit, so a room with two AC units looks like one bad unit, or a replaced unit inherits the old one's history. Faults split across categories, such as "AC leaking" under plumbing.
- How to improve itTag equipment so every job is logged against the right asset. Apply a rule: a second call within 30 days gets a full inspection, not a reset. Our AC guide for humid climates sets out a repeat-fault rule of thumb.
- Example targetMany hotels aim for no unit with three or more faults in 12 months without a repair-or-replace decision on record.
8. Rooms out of order
The rooms maintenance takes off sale. It turns maintenance performance into the language the owner and revenue manager use.
- How to calculate itOut of order room nights in the period divided by room nights available. Also track the number of rooms out of order on a fixed day each week, and the average nights per out of order period. Report planned renovation separately.
- What can misleadRooms parked in out of service instead of out of order, which hides them. Renovation blocks swamping the repair figure. And your PMS may count out of order rooms differently from your owner reports, so check the base before comparing.
- How to improve itEvery out of order room has a job, an owner and a return date, and the list is read every morning. Our guide to out of order rooms includes a policy you can copy.
- Example targetMany hotels aim to keep out of order room nights a small fraction of available room nights outside planned renovations, with no room out of order without a return date.
A one-page monthly report
Owners and general managers read one page. Put the eight numbers in a table with this month, the previous three months and one line of comment each. The comment matters more than the number: "Resolution time up because of the boiler parts delay, part arrives Friday" is a report. A bare percentage is not.
Then add three breakdowns, only where they tell you something:
- By category: AC, plumbing, electrical, furniture and fixtures, guest requests. This is where patterns show.
- By place: floor, wing, building or villa. A cluster of leaks under one riser is a different problem from leaks everywhere.
- By team: engineering, housekeeping, contractors. Use individual figures for coaching, privately, and never as a league table.
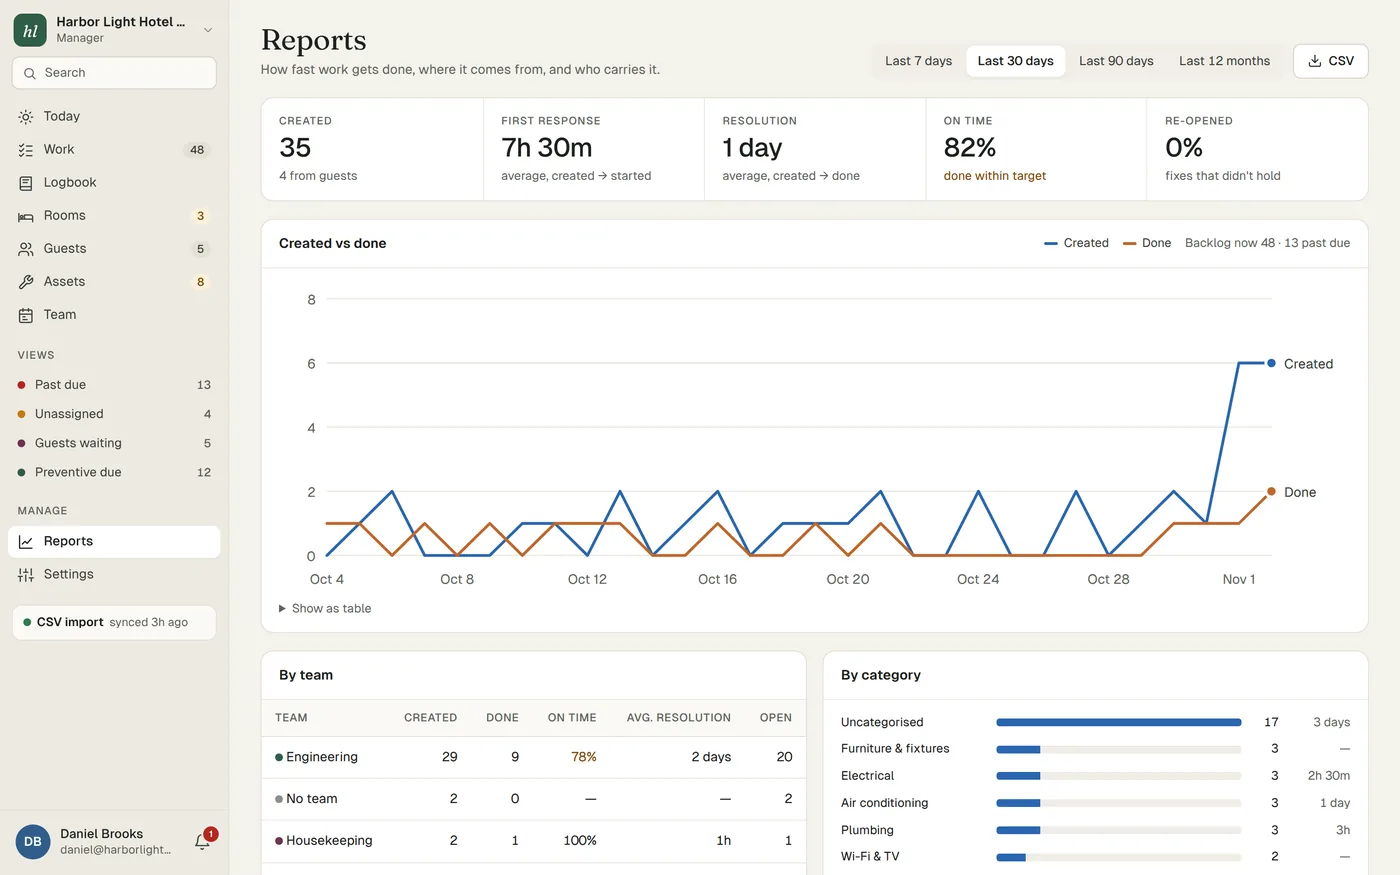
If you use Turndown, the Reports screen shows first response time, resolution time, on-time rate, re-open rate, created versus done and backlog age, broken down by team, category, place and person, with CSV export for the rest of your report. Asset pages flag units with several faults in 12 months.
Where to start
If you track nothing today, don't start with eight numbers. Start with three, every week: the count of past-due jobs, the age of the oldest open job, and the on-time rate. Read them at the weekly review for a month. Once they are trusted, add response and resolution time, then the rest.
Look at direction more than level. A hotel whose oldest job has gone from 90 days to 20 is doing better than one sitting proudly at 15 that crept up from 10. The trend shows if your habits are working.