What goes in the maintenance budget
On most hotel profit and loss statements, maintenance lives in a department called property operation and maintenance, or POM. It holds the cost of keeping the building and its equipment working: the engineering team's wages, repairs, service contracts and supplies. It sits with the other undistributed costs, so no single revenue department carries it.
What exactly goes in POM varies a little between charts of accounts. Some hotels report utilities separately, some keep grounds or pool chemicals elsewhere. Before you build a budget or compare it with anyone else's, ask your accountant for the list of accounts in your POM department. A comparison is only fair when both sides count the same things.
What the published numbers say
Good benchmarks for hotel maintenance spend exist, but most of them are sold by subscription, such as CBRE's Trends in the Hotel Industry and HotStats. These are the figures that are public, with their dates. Treat the older ones as history, not targets.
| Figure | Data year | Source |
|---|---|---|
| Maintenance at 5.0% of total revenue at US hotels, against an average of 4.5% since 1960 | 2005 | PKF Hospitality Research, Trends in the Hotel Industry, 2006 edition |
| From 4.7% of total revenue at convention hotels to 5.5% at limited-service hotels | 2005 | Same source |
| $1,017 per available room at limited-service hotels, the lowest, and $4,608 at resorts, the highest | 2005 | Same source |
| Labor at 49.7% of total POM expenses at the typical US hotel | 2005 | Same source |
| POM at 8.2% of total revenue, almost double the average of the previous five years, after POM spending was cut 30.8% | 2020 | CBRE Hotels Research, Property Operation and Maintenance: Maintaining the Value, 2022 |
| Labor averaged 50% of POM department expenses | 2015 to 2021 | Same source |
| POM per available room fell 1.8% a year (compound), while POM per occupied room grew 3.8% a year | 2015 to 2021 | Same source |
| Maintenance department costs up 5.0%, preliminary, from about 2,600 US hotels | 2024 | CBRE Hotels Research, All Eyes on Operating Costs in 2025 |
Three things stand out. First, labor is about half of maintenance spend, and has been for a long time, so your team's hours are the biggest line you control. Second, the percentage of revenue swings with revenue: in 2020 hotels cut maintenance spending by almost a third, yet its share of revenue nearly doubled because revenue fell further. Third, resorts spend far more per room than limited-service hotels, because they have more to maintain: pools, grounds, kitchens, spread-out buildings and plant.
Build it from the bottom up
A bottom-up budget starts with your building and works out what it costs to keep it running. It takes a few hours the first year and much less after that.
- List your equipment and contracts. Every AC unit, pump, boiler, generator, kitchen and laundry machine, the elevator, the fire alarm, the pool. Then every service contract with its annual cost and billing months.
- Turn the list into a preventive schedule. The preventive maintenance schedule builder counts the jobs per year for each plan. Multiply by the supplies each job uses: filters, belts, lamps, batteries, cleaning chemicals.
- Price repairs from your history. Take the last twelve months of work orders and group the spend by category: plumbing, electrical, HVAC, furniture and fixtures, painting, kitchen, laundry. If you have no records, keep them for three months and project from that.
- Work out the labor. Count the hours the team has after leave and training. Compare them with the planned jobs per week from the schedule plus your usual repair load. If the hours don't fit, the gap is either overtime, a contractor or work that won't get done.
- Add the outside call-outs. Emergency plumbers, electricians and AC technicians for work your team can't do. Your history shows how many you had.
- Phase it by month. AC services before the hot season, generator service before storm season, painting and deep work in the quiet months. Contracts billed quarterly or yearly go in the month they are paid.
- Hold a contingency. Agree the amount with your owner or asset manager. Old buildings and old plant need more.
The budget lines
| Line | What goes in it | How to estimate it |
|---|---|---|
| Engineering labor | Wages, overtime, on-call pay, and payroll costs if your POM carries them. | Team roster and pay rates, plus overtime from last year. |
| Service contracts | Elevator, fire alarm and sprinklers, extinguishers, pest control, pool service, generator service, HVAC or chiller, water treatment. | Current contracts, with any increase written into them. |
| Preventive supplies | Filters, belts, lamps, batteries, coil cleaner, lubricants. | Jobs per year from the schedule times the supplies per job. |
| Repair parts and materials | Plumbing, electrical, HVAC parts, locks, furniture fittings, paint. | Last twelve months of repairs by category. |
| Outside repairs | Call-outs and specialist work not under a contract. | Last year's invoices. |
| Tools and equipment | Hand tools, meters, ladders, safety gear. | A replacement list for the year. |
| Training and certificates | Licenses and courses your team needs to keep. | Renewal dates and course costs. |
| Contingency | Failures nobody can predict. | Agreed with the owner. |
Capital replacements sit outside this list. A new chiller, a roof or forty new AC units are capital projects with their own approval. Keep a separate capital plan, and make sure the maintenance budget doesn't quietly carry pieces of it.
Repair or replace: where the line falls
The hardest budget arguments are about equipment that keeps breaking. A clear rule saves a lot of meetings.
- Set a capital thresholdAnything above an agreed amount, or with a life of more than a year or two, goes on the capital plan. Your owner or accountant usually sets this.
- Count the repairs per unitThree faults in six months on one AC unit is a pattern. Add up what those repairs cost, including the room nights the unit kept off sale.
- Compare with replacementWhen a year of repairs on a unit approaches a meaningful share of its replacement cost, and the unit is near the end of its expected life, put it on the capital list with the numbers attached.
- Include the roomA failing AC in a guest room costs more than its repairs. The out of order room cost calculator puts a number on the nights it is off sale.
Track it every month
A budget only helps if someone looks at it while there is still time to act. Once a month, compare actual spend with budget for each line and write one sentence on anything more than a little off.
Two ratios make the numbers comparable across months and years:
- Cost per available room: maintenance spend divided by the number of rooms in the hotel. It shows the cost of keeping the building up, whatever the occupancy.
- Cost per occupied room: maintenance spend divided by the room nights sold. It rises in quiet months, because the fixed costs are spread over fewer guests. That is normal, and it is why the CBRE figures above show the two ratios moving in opposite directions.
Then look behind the numbers. Which categories of work order drove the repairs line? Which units appear again and again? How much of the team's time went to planned work and how much to breakdowns? The hotel maintenance KPIs guide shows how to measure each of these.
Six budget mistakes that cost hotels later
- Last year plus a percentageIt carries forward last year's surprises and misses this year's. A generator that is a year older, or a new contract, changes the numbers.
- Contracts in the wrong monthAn annual elevator or fire contract paid in March makes March look like a disaster and the rest of the year look fine. Put each payment in the month it is due.
- Spreading spend evenlyMaintenance is seasonal. AC work peaks before the hot season, painting in the quiet months. A flat monthly figure makes every month look wrong.
- No line for labor hoursA budget that funds the parts for a preventive program but not the hours to do it produces a schedule nobody follows. Check the hours as well as the money.
- Capital hiding in repairsReplacing AC units one by one through the repairs line hides a capital decision and breaks the budget by autumn. Put replacements on the capital plan.
- Cutting preventive work firstWhen money is tight, preventive supplies and contracts look easy to cut. The cost comes back as breakdowns, rooms off sale and emergency call-outs at night rates.
Download the budget worksheet
The worksheet has every line above across twelve months, with columns for last year's actual and this year's total. It prints on one landscape page per sheet.
Where the numbers come from in Turndown
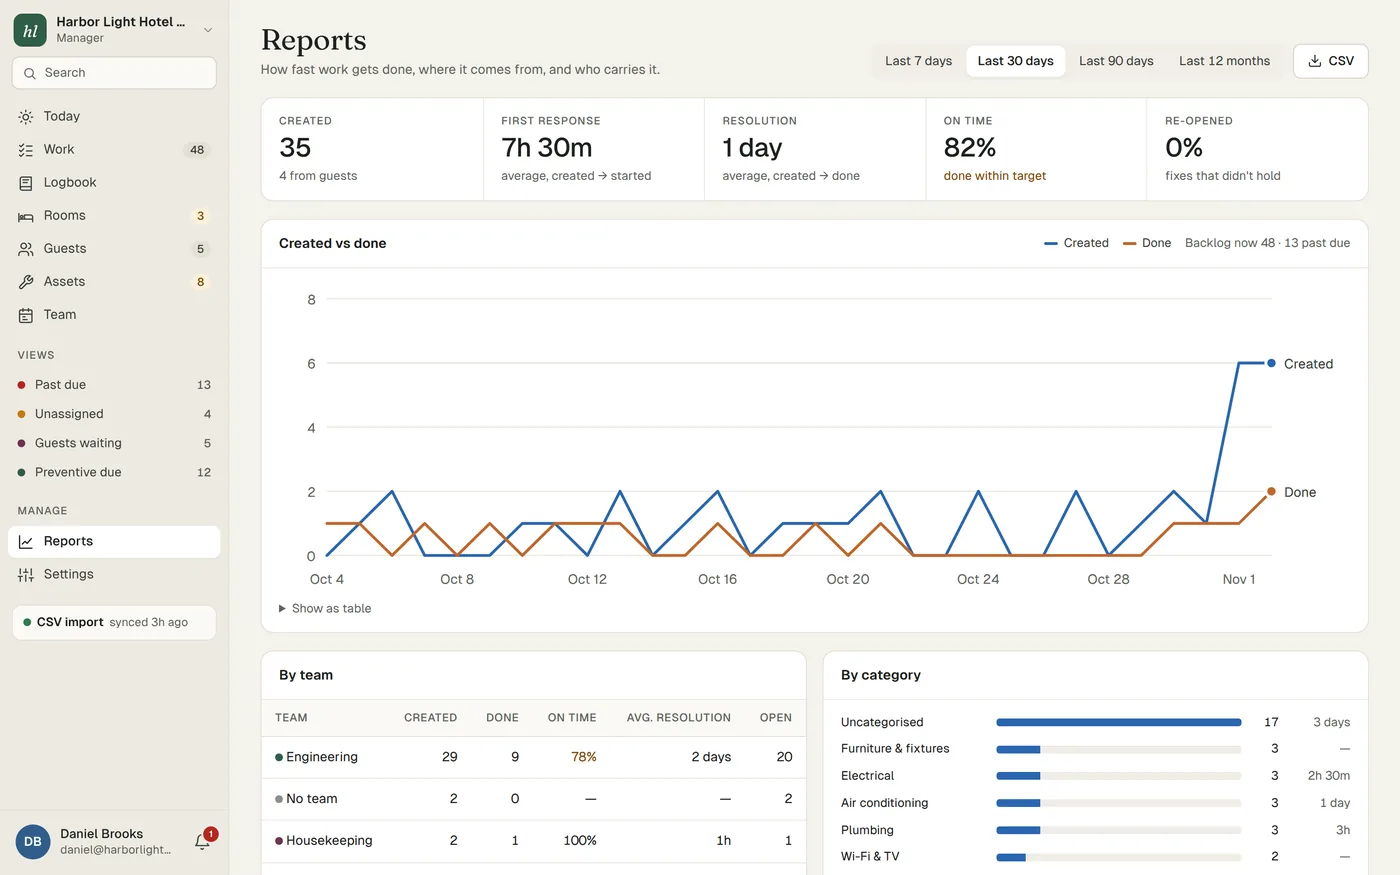
A bottom-up budget needs a cost history, and that is hard to keep on paper. In Turndown, every asset page shows twelve months of services and faults with what they cost, each vendor shows what you spent with them over the year, and the equipment insights split spend by category and into planned and repair work. Reports show the work behind the money, from on-time rate to backlog age, and export to CSV for your spreadsheet. See how equipment and preventive maintenance work.